
by


|
by
| |
DBI extension module for rendering charts directly from any DBI and SQL compatible database. DBIx::Chart extends SQL to return a VARBINARY image value using aggregate function syntax to define the type of chart, and various pseudo-columns to define the properties of the image. The following types of charts are supported (via DBD::Chart):
|
 |
 | |||
|
Why DBIx::Chart ? One of the most common uses for data extracted from a database is visualization. Prior to DBIx::Chart, extra software was always required, and extra programming steps needed to render those charts, and the APIs and/or tools for generating the charts often didn't mate well with existing SQL tools. With DBIx::Chart, every DBMS appears to have an internal rendering engine, accessed entirely via SQL.
| |||||
 |
DBIx::Chart is a pure Perl subclass of DBI.
Current VersionRelease 0.05 | ||||
Prerequisites and ConformanceDBIx::Chart requires the following Perl modules(versions are recommended only, as they're the version I built with...if you're feeling frisky, you can try older or newer versions.):
Since DBIx::Chart is a simple subclass of DBI, all the usual DBI functions are supported. | |||||
EXAMPLESRefer to the included t/plottest.t test script for complete details of connecting, populating datapoints, and fetching the image and any associated imagemap. Here's a bit of code to generate a piechart from an Oracle connection:
use DBIx::Chart;
my $dbh = DBIx::Chart->connect('dbi:Oracle:bunceville', $user, $pass)
    or die "Cannot connect\n";
#
#    example: create a pie chart
#
$rsth = $dbh->prepare(
"SELECT region, sum(sales) FROM widget_sales_tbl
 WHERE year=2002 AND product='widgets'
 GROUP BY region
 RETURNING PIECHART(*)
 WHERE WIDTH=400 AND HEIGHT=400 AND
 TITLE = '2002 Widget Sales By Region' AND
 COLOR IN ('red', 'green', 'blue', 'lyellow', 'lpurple') AND
 BACKGROUND='lgray' AND
 SIGNATURE='Copyright(C) 2001, GOWI Systems, Inc.'");
$rsth->execute;
$rsth->bind_col(1, \$buf);
$rsth->fetch;
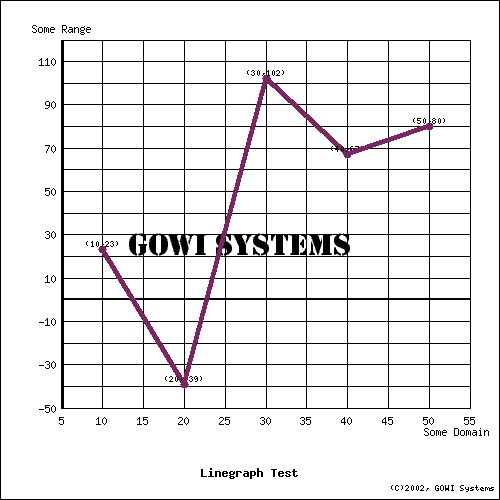
The following set of charts were rendered using DBIx::Chart. The SQL statement used to create a chart is available by clicking the indicated link above each image. Simple Linegraph with Logo See the SQL
select * from simpline
    returning linegraph(*), imagemap
    where WIDTH=500
    AND HEIGHT=500
    AND X_AXIS='Some Domain'
    AND Y_AXIS='Some Range'
    AND TITLE='Linegraph Test'
    AND SIGNATURE='(C)2002, GOWI Systems'
    AND LOGO='t/gowilogo.png'
    AND FORMAT='PNG'
    AND SHOWGRID=1
    AND LINEWIDTH=4
    AND MAPNAME='simpline'
    AND MAPURL='http://www.gowi.com/cgi-bin/sample.pl?x=:X&y=:Y&z=:Z&plotno=:PLOTNUM'
    AND MAPTYPE='HTML'
    AND COLOR='newcolor'
    AND SHAPE='fillcircle'
    AND SHOWVALUES=1
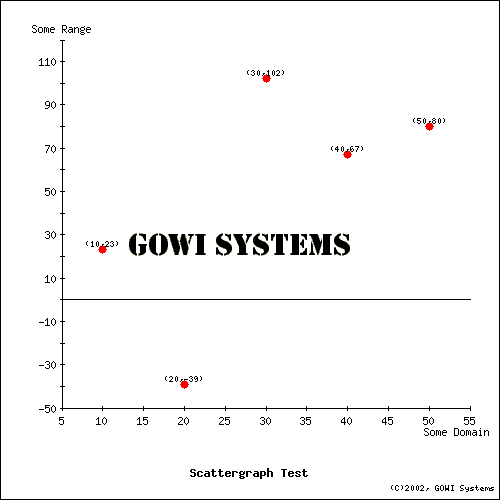
 Simple Pointgraph with Logo See the SQL
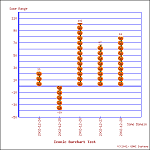
select * from simpline
    returning pointgraph(x,y), imagemap
    where WIDTH=500
    AND HEIGHT=500
    AND X_AXIS='Some Domain'
    and Y_AXIS='Some Range'
    AND TITLE='Scattergraph Test'
    AND SIGNATURE='(C)2002, GOWI Systems'
    AND LOGO='t/gowilogo.png'
    AND FORMAT='PNG'
    AND SHOWGRID=0
    AND MAPNAME='simpscat_map'
    AND MAPURL='http://www.gowi.com/cgi-bin/sample.pl?x=:X&y=:Y&z=:Z&plotno=:PLOTNUM'
    AND MAPTYPE='HTML'
    AND SHOWVALUES=1
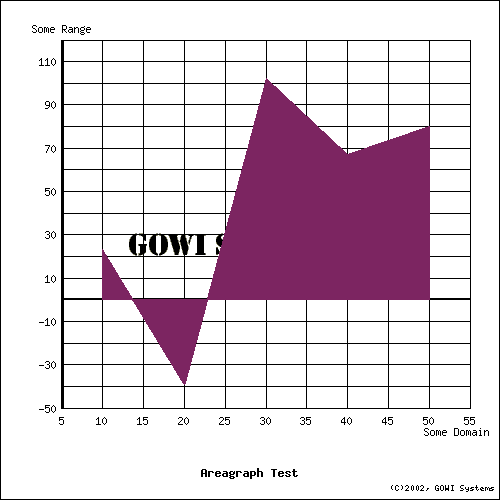
 Simple Areagraph See the SQL
select * from simpline
    returning areagraph(*), imagemap
    where WIDTH=500
    AND HEIGHT=500
    AND X_AXIS='Some Domain'
    AND Y_AXIS='Some Range'
    AND TITLE='Areagraph Test'
    AND SIGNATURE='(C)2002, GOWI Systems'
    AND LOGO='t/gowilogo.png'
    AND FORMAT='PNG'
    AND SHOWGRID=1
    AND MAPNAME='simparea_map'
    AND COLOR='newcolor'
    AND MAPURL='http://www.gowi.com/cgi-bin/sample.pl?x=:X&y=:Y&z=:Z&plotno=:PLOTNUM'
    AND MAPTYPE='HTML' AND SHOWVALUES=0
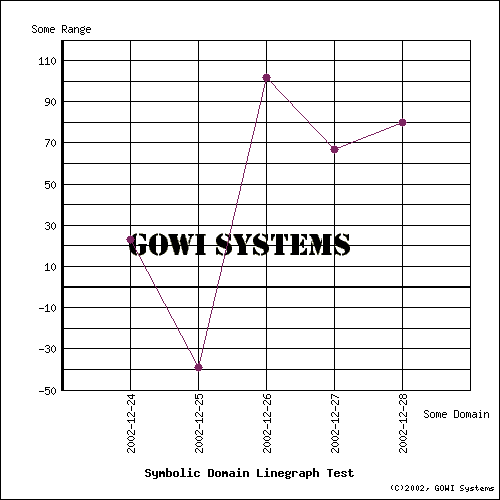
 Symbolic Range Linegraph See the SQL
select * from symline
    returning linegraph(*), imagemap
    where WIDTH=500 AND HEIGHT=500
    AND X_AXIS='Some Domain'
    and Y_AXIS='Some Range'
    AND TITLE='Symbolic Domain Linegraph Test'
    AND SIGNATURE='(C)2002, GOWI Systems'
    AND LOGO='t/gowilogo.png'
    AND FORMAT='PNG'
    AND SHOWGRID=1
    AND MAPNAME='symline_map'
    AND MAPURL='http://www.gowi.com/cgi-bin/sample.pl?x=:X&y=:Y&z=:Z&plotno=:PLOTNUM'
    AND MAPTYPE='HTML' AND COLOR=newcolor AND SHAPE=fillcircle
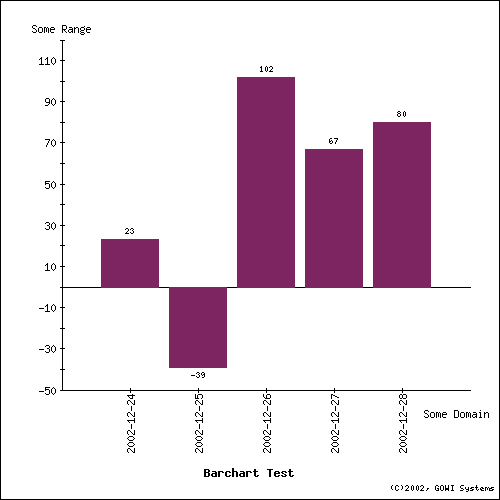
 Simple Barchart See the SQL
select * from symline
    returning barchart(*), imagemap
    where WIDTH=500 AND HEIGHT=500
    AND X_AXIS='Some Domain'
    and Y_AXIS='Some Range'
    AND TITLE='Barchart Test'
    AND SIGNATURE='(C)2002, GOWI Systems'
    AND FORMAT='PNG'
    AND SHOWVALUES=1
    AND MAPNAME='simpbar_map'
    AND MAPURL='http://www.gowi.com/cgi-bin/sample.pl?x=:X&y=:Y&z=:Z&plotno=:PLOTNUM'
    AND MAPTYPE='HTML' AND COLOR=newcolor
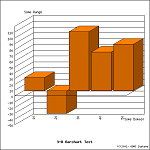
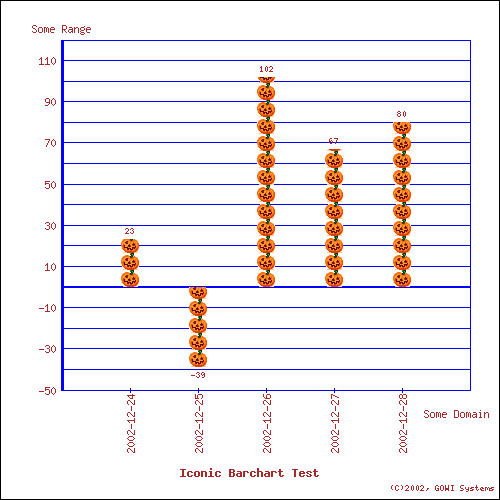
 Iconic Barchart See the SQL
select * from symline
    returning barchart(*), imagemap
    where WIDTH=500
    AND HEIGHT=500
    AND X_AXIS='Some Domain'
    and Y_AXIS='Some Range'
    AND TITLE='Iconic Barchart Test'
    AND SIGNATURE='(C)2002, GOWI Systems'
    AND FORMAT='PNG'
    AND SHOWVALUES=1
    AND ICON='t/pumpkin.png'
    AND MAPNAME='iconbars_map'
    AND SHOWGRID=1
    AND GRIDCOLOR='blue'
    AND TEXTCOLOR='dbrown'
    AND MAPSCRIPT='ONCLICK="alert(''Got X=:X, Y=:Y'')"'
    AND MAPURL='http://www.gowi.com/cgi-bin/sample.pl?x=:X&y=:Y&z=:Z&plotno=:PLOTNUM'
    AND MAPTYPE='HTML'
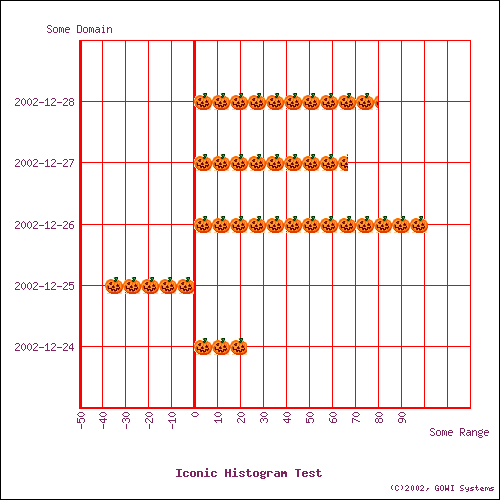
 Iconic Histogram See the SQL
select * from symline
    returning histogram(*), imagemap
    where WIDTH=500
    AND HEIGHT=500
    AND X_AXIS='Some Domain'
    AND Y_AXIS='Some Range'
    AND TITLE='Iconic Histogram Test'
    AND SIGNATURE='(C)2002, GOWI Systems'
    AND FORMAT='PNG'
    AND ICON='t/pumpkin.png'
    AND MAPNAME='iconhisto_map'
    AND SHOWGRID=1
    AND GRIDCOLOR='red'
    AND TEXTCOLOR='newcolor'
    AND MAPSCRIPT='ONCLICK="alert(''Got X=:X, Y=:Y'')"'
    AND MAPURL='http://www.gowi.com/cgi-bin/sample.pl?x=:X&y=:Y&z=:Z&plotno=:PLOTNUM'
    AND MAPTYPE='HTML'
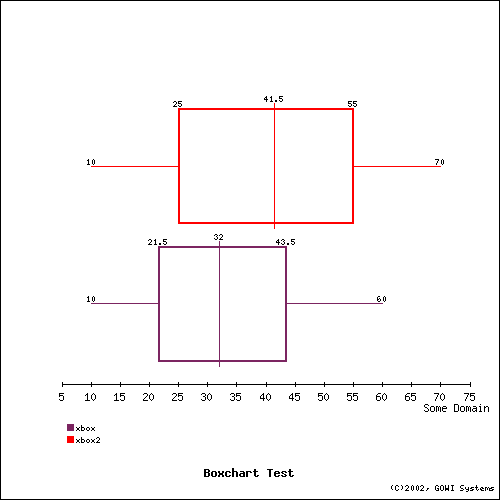
 Simple Box & Whisker Chart See the SQL
select * from simpbox
    returning boxchart(*), imagemap
    where WIDTH=500
    AND HEIGHT=500
    AND X_AXIS='Some Domain'
    AND TITLE='Boxchart Test'
    AND SIGNATURE='(C)2002, GOWI Systems'
    AND FORMAT='PNG'
    AND COLORS IN ('newcolor', 'red')
    AND SHOWVALUES=1
    AND MAPNAME='simpbox_map'
    AND MAPURL='http://www.gowi.com/cgi-bin/sample.pl?x=:X&y=:Y&z=:Z&plotno=:PLOTNUM'
    AND MAPTYPE='HTML'
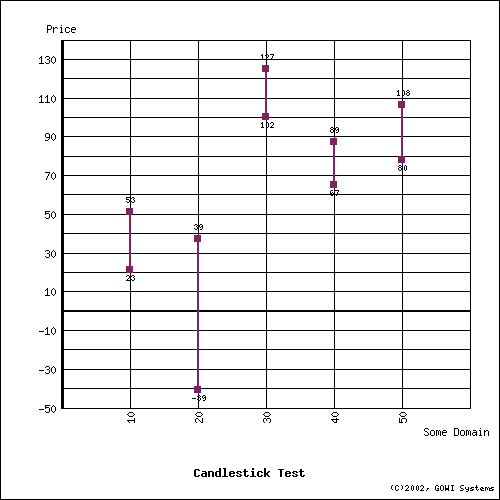
 Simple Candlechart See the SQL
select * from simpcandle
    returning candlestick(*), imagemap
    where WIDTH=500
    AND HEIGHT=500
    AND X_AXIS='Some Domain'
    AND Y_AXIS = 'Price'
    AND TITLE='Candlestick Test'
    AND SIGNATURE='(C)2002, GOWI Systems'
    AND FORMAT='PNG'
    AND COLORS IN ('newcolor')
    AND SHAPE='fillsquare'
    AND SHOWVALUES=1
    AND SHOWGRID=1
    AND MAPNAME='simpcandle_map'
    AND MAPURL='http://www.gowi.com/cgi-bin/sample.pl?x=:X&y=:Y&z=:Z&plotno=:PLOTNUM'
    AND MAPTYPE='HTML'
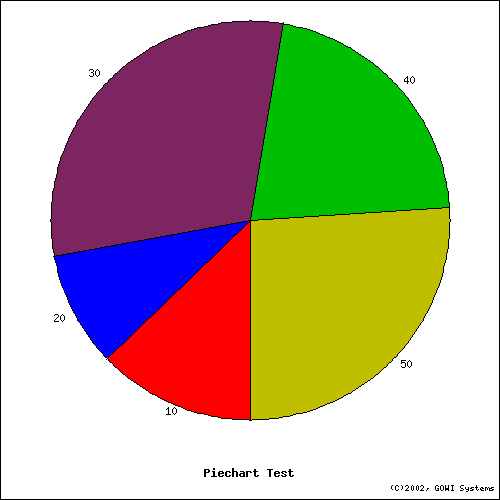
 Basic Piechart See the SQL
select * from simppie
    returning piechart(*), imagemap
    where WIDTH=500
    AND HEIGHT=500
    AND X_AXIS='Some Domain'
    AND TITLE='Piechart Test'
    AND SIGNATURE='(C)2002, GOWI Systems'
    AND FORMAT='PNG'
    AND COLORS IN ('red', 'blue', 'newcolor', 'green', 'yellow')
    AND MAPNAME='simppie_map'
    AND MAPURL='http://www.gowi.com/cgi-bin/sample.pl?x=:X&y=:Y&z=:Z&plotno=:PLOTNUM'
    AND MAPTYPE='HTML'
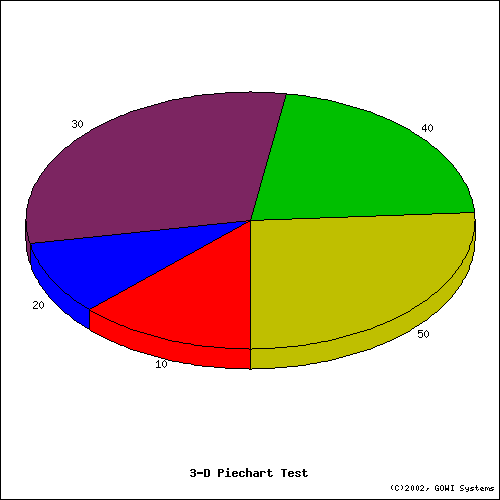
 3D Piechart See the SQL
select * from simppie
    returning piechart(*), imagemap
    where WIDTH=500
    AND HEIGHT=500
    AND X_AXIS='Some Domain'
    AND TITLE='3-D Piechart Test'
    AND SIGNATURE='(C)2002, GOWI Systems'
    AND FORMAT='PNG'
    AND COLORS IN ('red', 'blue', 'newcolor', 'green', 'yellow')
    AND THREE_D=1
    AND MAPNAME='pie3d_map'
    AND MAPURL='http://www.gowi.com/cgi-bin/sample.pl?x=:X&y=:Y&z=:Z&plotno=:PLOTNUM'
    AND MAPTYPE='HTML'
 3D Barchart See the SQL
select * from simpline
    returning barchart(*), imagemap
    where WIDTH=500
    AND HEIGHT=500
    AND X_AXIS='Some Domain'
    AND Y_AXIS='Some Range'
    AND TITLE='3-D Barchart Test'
    AND SIGNATURE='(C)2002, GOWI Systems'
    AND FORMAT='PNG'
    AND COLORS IN ('orange')
    AND THREE_D=1
    AND SHOWGRID=1
    AND MAPNAME='bar3d_map'
    AND MAPURL='http://www.gowi.com/cgi-bin/sample.pl?x=:X&y=:Y&z=:Z&plotno=:PLOTNUM'
    AND MAPTYPE='HTML'
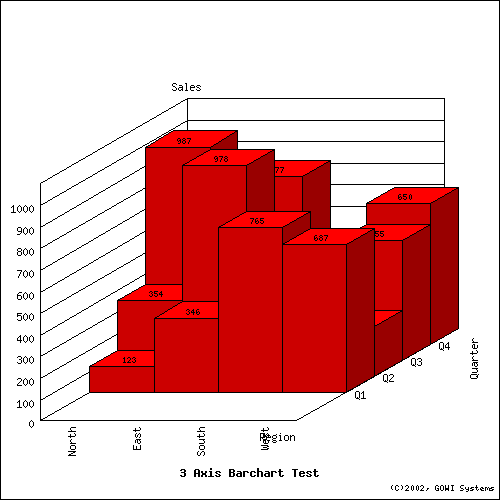
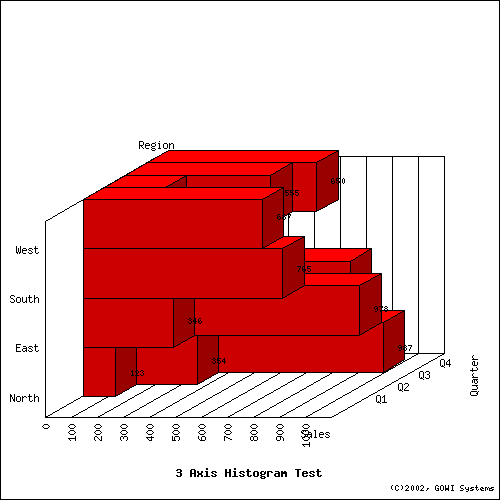
 3 Axis Barchart See the SQL
select * from bar3axis
    returning barchart(*), imagemap
    where WIDTH=500
    AND HEIGHT=500
    AND TITLE='3 Axis Barchart Test'
    AND SIGNATURE='(C)2002, GOWI Systems'
    AND X_AXIS='Region'
    AND Y_AXIS='Sales'
    AND Z-AXIS='Quarter'
    AND FORMAT='PNG'
    AND COLORS IN ('red')
    AND SHOWGRID=1
    AND SHOWVALUES=1
    AND MAPNAME='bar3axis_map'
    AND MAPURL='http://www.gowi.com/cgi-bin/sample.pl?x=:X&y=:Y&z=:Z&plotno=:PLOTNUM'
    AND MAPTYPE='HTML'
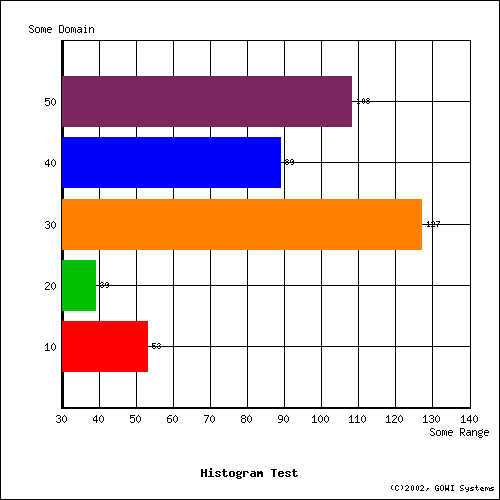
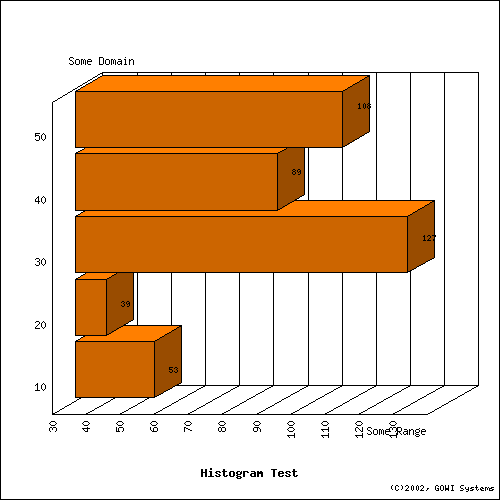
 Simple Histogram See the SQL
select * from simppie
    returning histogram(*), imagemap
    where WIDTH=500
    AND HEIGHT=500
    AND TITLE='Histogram Test'
    AND SIGNATURE='(C)2002, GOWI Systems'
    AND X_AXIS='Some Domain'
    AND Y_AXIS='Some Range'
    AND FORMAT='PNG'
    AND COLOR IN ('red', 'green', 'orange', 'blue', 'newcolor')
    AND SHOWGRID=1
    AND SHOWVALUES=1
    AND MAPNAME='simphisto_map'
    AND MAPURL='http://www.gowi.com/cgi-bin/sample.pl?x=:X&y=:Y&z=:Z&plotno=:PLOTNUM'
    AND MAPTYPE='HTML'
 3D Histogram See the SQL
select * from simppie
    returning histogram(*), imagemap
    where WIDTH=500
    AND HEIGHT=500
    AND TITLE='Histogram Test'
    AND SIGNATURE='(C)2002, GOWI Systems'
    AND X_AXIS='Some Domain'
    AND Y_AXIS='Some Range'
    AND FORMAT='PNG'
    AND COLOR='orange'
    AND THREE_D=1
    AND SHOWGRID=1
    AND SHOWVALUES=1
    AND MAPNAME='histo3d_map'
    AND MAPURL='http://www.gowi.com/cgi-bin/sample.pl?x=:X&y=:Y&z=:Z&plotno=:PLOTNUM'
    AND MAPTYPE='HTML'
 3 Axis Histogram See the SQL
select * from bar3axis
    returning histogram(*), imagemap
    where WIDTH=500
    AND HEIGHT=500
    AND TITLE='3 Axis Histogram Test'
    AND SIGNATURE='(C)2002, GOWI Systems'
    AND X_AXIS='Region'
    AND Y_AXIS='Sales'
    AND Z_AXIS='Quarter'
    AND FORMAT='PNG'
    AND COLORS='red'
    AND SHOWGRID=1
    AND SHOWVALUES=1
    AND MAPNAME='histo3axis_map'
    AND MAPURL='http://www.gowi.com/cgi-bin/sample.pl?x=:X&y=:Y&z=:Z&plotno=:PLOTNUM'
    AND MAPTYPE='HTML'
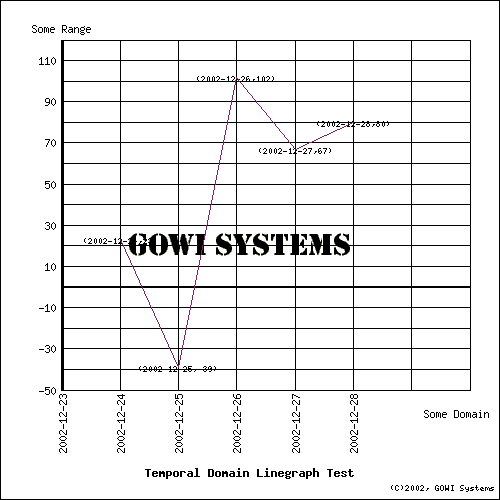
 Temporal Domain Linegraph See the SQL
select * from templine
    returning linegraph(xdate, y), imagemap
    where WIDTH=500
    AND HEIGHT=500
    AND TITLE='Temporal Domain Linegraph Test'
    AND SIGNATURE='(C)2002, GOWI Systems'
    AND X_AXIS='Some Domain'
    AND Y_AXIS='Some Range'
    AND X_ORIENT='VERTICAL'
    AND LOGO='t/gowilogo.png'
    AND FORMAT='PNG'
    AND COLORS=newcolor
    AND SHOWGRID=1
    AND SHOWVALUES=1
    AND MAPNAME='templine_map'
    AND MAPURL='http://www.gowi.com/cgi-bin/sample.pl?x=:X&y=:Y&z=:Z&plotno=:PLOTNUM'
    AND MAPTYPE='HTML'
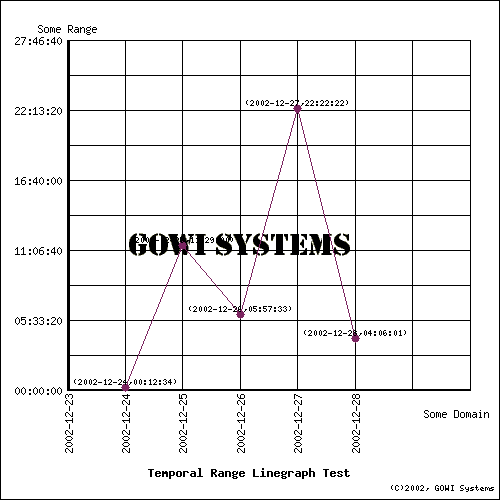
 Temporal Domain/Range Linegraph See the SQL
select * from templine2
    returning linegraph(*), imagemap
    where WIDTH=500
    AND HEIGHT=500
    AND TITLE='Temporal Range Linegraph Test'
    AND SIGNATURE='(C)2002, GOWI Systems'
    AND X_AXIS='Some Domain'
    AND Y_AXIS='Some Range'
    AND X_ORIENT='VERTICAL'
    AND LOGO='t/gowilogo.png'
    AND FORMAT='PNG'
    AND COLORS=newcolor
    AND SHOWGRID=1
    AND SHOWVALUES=1
    AND SHAPE=fillcircle
    AND MAPNAME='templine2_map'
    AND MAPURL='http://www.gowi.com/cgi-bin/sample.pl?x=:X&y=:Y&z=:Z&plotno=:PLOTNUM'
    AND MAPTYPE='HTML'
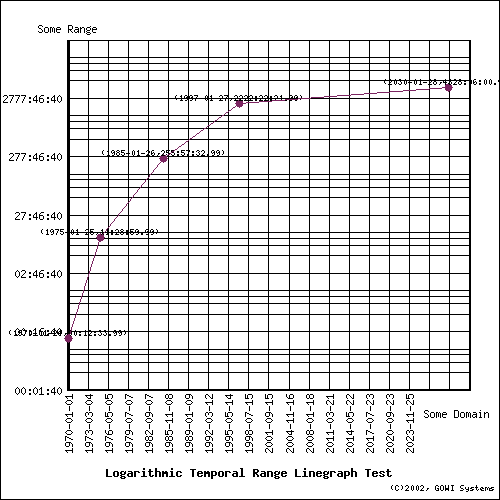
 Logarithmic Temporal Linegraph See the SQL
select * from logtempline
    returning linegraph(*), imagemap
    where WIDTH=500
    AND HEIGHT=500
    AND TITLE='Logarithmic Temporal Range Linegraph Test'
    AND SIGNATURE='(C)2002, GOWI Systems'
    AND X_AXIS='Some Domain'
    AND Y_AXIS='Some Range'
    AND X_ORIENT='VERTICAL'
    AND Y-LOG=1
    AND FORMAT='PNG'
    AND COLORS=newcolor
    AND SHOWGRID=1
    AND SHOWVALUES=1
    AND SHAPE=fillcircle
    AND MAPNAME='logtempline_map'
    AND MAPURL='http://www.gowi.com/cgi-bin/sample.pl?x=:X&y=:Y&z=:Z&plotno=:PLOTNUM'
    AND MAPTYPE='HTML'
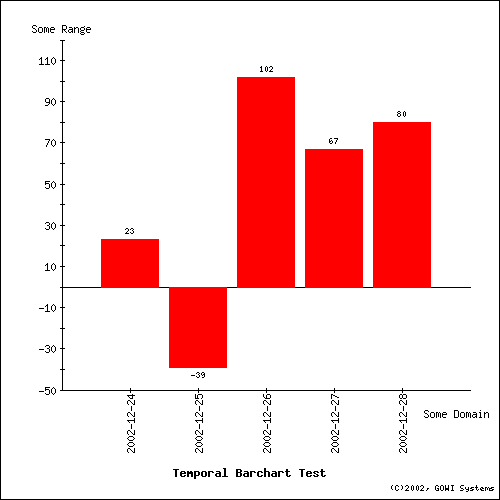
 Temporal Barchart See the SQL
select * from templine
    returning barchart(*), imagemap
    where WIDTH=500
    AND HEIGHT=500
    AND TITLE='Temporal Barchart Test'
    AND SIGNATURE='(C)2002, GOWI Systems'
    AND X_AXIS='Some Domain'
    AND Y_AXIS='Some Range'
    AND FORMAT='PNG'
    AND COLORS=red
    AND SHOWVALUES=1
    AND MAPNAME='tempbar_map'
    AND MAPURL='http://www.gowi.com/cgi-bin/sample.pl?x=:X&y=:Y&z=:Z&plotno=:PLOTNUM'
    AND MAPTYPE='HTML'
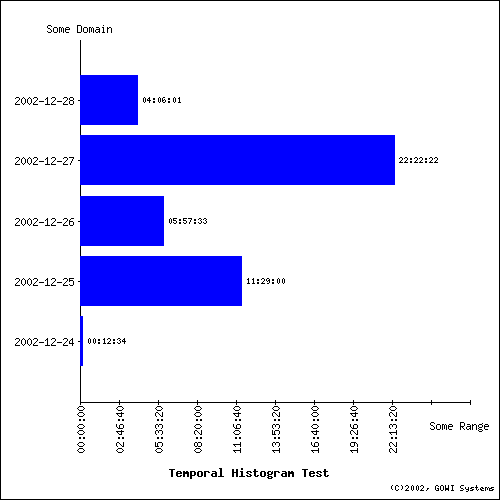
 Temporal Histogram See the SQL
select * from templine2
    returning histogram(*), imagemap
    where WIDTH=500
    AND HEIGHT=500
    AND TITLE='Temporal Histogram Test'
    AND SIGNATURE='(C)2002, GOWI Systems'
    AND X_AXIS='Some Domain'
    AND Y_AXIS='Some Range'
    AND FORMAT='PNG'
    AND COLORS=blue
    AND SHOWVALUES=1
    AND MAPNAME='temphisto_map'
    AND MAPURL='http://www.gowi.com/cgi-bin/sample.pl?x=:X&y=:Y&z=:Z&plotno=:PLOTNUM'
    AND MAPTYPE='HTML'
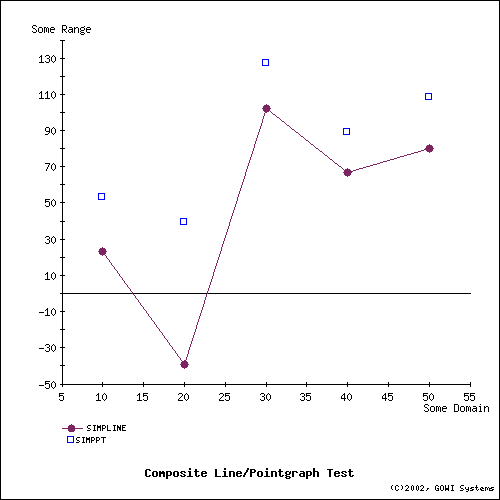
 Composite Line/Pointgraph See the SQL
select * from
    (select * from simpline
    returning linegraph(*)
        where color=newcolor
        AND shape='fillcircle') simpline,
    (select  * from simppie
    returning pointgraph(*)
        where color=blue
        AND shape='opensquare') simppt
    returning image, imagemap
    where WIDTH=500
    AND HEIGHT=500
    AND TITLE='Composite Line/Pointgraph Test'
    AND SIGNATURE='(C)2002, GOWI Systems'
    AND X_AXIS='Some Domain'
    AND Y_AXIS='Some Range'
    AND FORMAT='PNG'
    AND MAPNAME='complinept_map'
    AND MAPURL='http://www.gowi.com/cgi-bin/sample.pl?x=:X&y=:Y&z=:Z&plotno=:PLOTNUM'
    AND MAPTYPE='HTML'
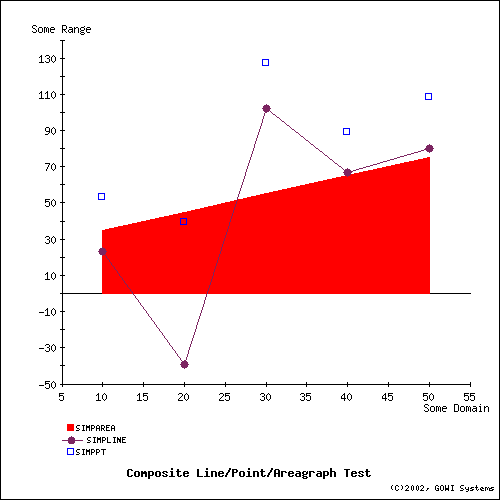
 Composite Line/Point/Areagraph See the SQL
select * from
    (select * from simpline
    returning linegraph(*)
        where color=newcolor
        AND shape=fillcircle) simpline,
    (select * from simppie
    returning pointgraph(*)
        where color=blue
        AND shape=opensquare) simppt,
    (select * from complpa
    returning areagraph(*)
        where color=red) simparea
    returning image, imagemap
    where WIDTH=500
    AND HEIGHT=500
    AND TITLE='Composite Line/Point/Areagraph Test'
    AND SIGNATURE='(C)2002, GOWI Systems'
    AND X_AXIS='Some Domain'
    AND Y_AXIS='Some Range'
    AND FORMAT='PNG'
    AND MAPNAME='complpa_map'
    AND MAPURL='http://www.gowi.com/cgi-bin/sample.pl?x=:X&y=:Y&z=:Z&plotno=:PLOTNUM'
    AND MAPTYPE='HTML'
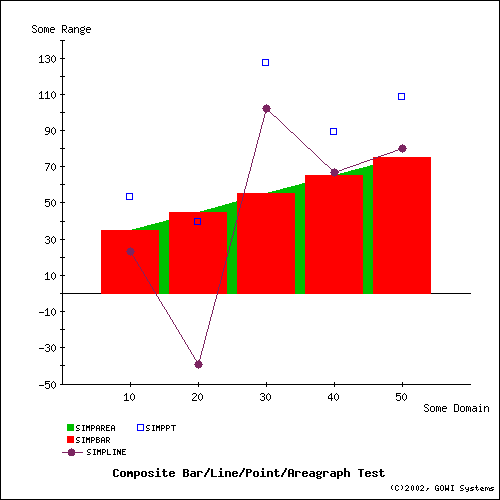
 Composite Line/Point/Areagraph/Barchart See the SQL
select * from
    (select * from simpline
    returning linegraph(*)
        where color=newcolor
        AND shape=fillcircle) simpline,
    (select * from simppie
    returning pointgraph(*)
        where color=blue
        AND shape=opensquare) simppt,
    (select * from complpa
    returning areagraph(*)
        where color=green) simparea,
    (select * from complpa
    returning barchart(*)
        where color=red) simpbar
    returning image, imagemap
    where WIDTH=500
    AND HEIGHT=500
    AND TITLE='Composite Bar/Line/Point/Areagraph Test'
    AND SIGNATURE='(C)2002, GOWI Systems'
    AND X_AXIS='Some Domain'
    AND Y_AXIS='Some Range'
    AND FORMAT='PNG'
    AND MAPNAME='compblpa_map'
    AND MAPURL='http://www.gowi.com/cgi-bin/sample.pl?x=:X&y=:Y&z=:Z&plotno=:PLOTNUM'
    AND MAPTYPE='HTML'
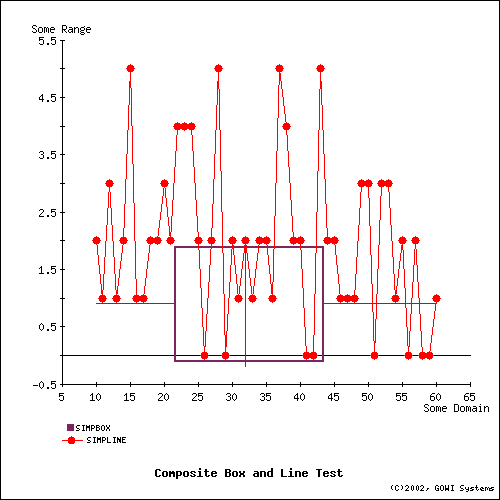
 Composite Linegraph/Boxchart See the SQL
select * from
    (select * from complnbox
    returning linegraph(*)
    where color=red
    AND shape=fillcircle) simpline,
    (select * from simpbox
    returning boxchart(*)
        where color=newcolor) simpbox
    returning image, imagemap
    where WIDTH=500
    AND HEIGHT=500
    AND TITLE='Composite Box
    AND Line Test'
    AND SIGNATURE='(C)2002, GOWI Systems'
    AND X_AXIS='Some Domain'
    AND Y_AXIS='Some Range'
    AND FORMAT='PNG'
    AND MAPNAME='complnbox_map'
    AND MAPURL='http://www.gowi.com/cgi-bin/sample.pl?x=:X&y=:Y&z=:Z&plotno=:PLOTNUM'
    AND MAPTYPE='HTML'
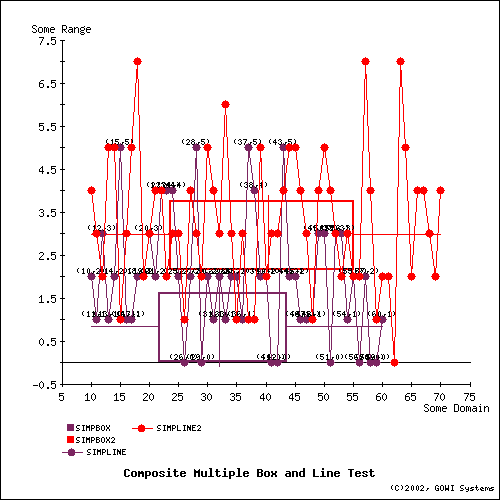
 Composite Line/Line/Box/Boxchart See the SQL
select * from
    (select * from complnbox
    returning linegraph(*)
    where color=newcolor
    AND shape=fillcircle
        and showvalues=1) simpline,
    (select * from simpbox
    returning boxchart(*)
    where color=newcolor) simpbox,
    (select * from compllbb
    returning linegraph(*)
    where color=red
    AND shape=fillcircle
        and showvalues=0) simpline2,
    (select * from simpbox2
    returning boxchart(*)
    where color=red) simpbox2
    returning image, imagemap
    where WIDTH=500
    AND HEIGHT=500
    AND TITLE='Composite Multiple Box
    AND Line Test'
    AND SIGNATURE='(C)2002, GOWI Systems'
    AND X_AXIS='Some Domain'
    AND Y_AXIS='Some Range'
    AND FORMAT='PNG'
    AND MAPNAME='compllbb_map'
    AND MAPURL='http://www.gowi.com/cgi-bin/sample.pl?x=:X&y=:Y&z=:Z&plotno=:PLOTNUM'
    AND MAPTYPE='HTML'
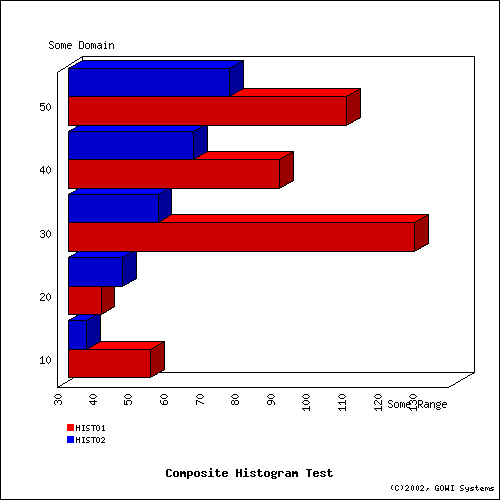
 Composite Histograms See the SQL
select * from
    (select * from simppie returning histogram(*)
        where color=red) histo1,
    (select * from complpa returning histogram(*)
        where color=blue) histo2
    returning image, imagemap
    where WIDTH=500
    AND HEIGHT=500
    AND TITLE='Composite Histogram Test'
    AND SIGNATURE='(C)2002, GOWI Systems'
    AND X_AXIS='Some Domain'
    AND Y_AXIS='Some Range'
    AND FORMAT='PNG'
    AND THREE_D=1
    AND SHOWVALUES = 1
    AND MAPNAME='comphisto_map'
    AND MAPURL='http://www.gowi.com/cgi-bin/sample.pl?x=:X&y=:Y&z=:Z&plotno=:PLOTNUM'
    AND MAPTYPE='HTML'
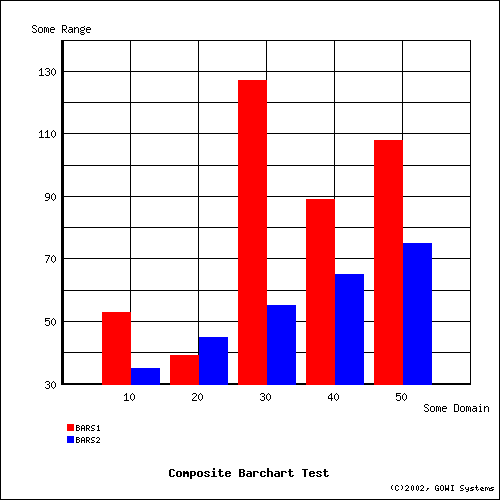
 Composite Barcharts See the SQL
select * from
    (select * from simppie
    returning barchart(*)
        where color=red) bars1,
    (select * from complpa
    returning barchart(*)
        where color=blue) bars2
    returning image, imagemap
    where WIDTH=500
    AND HEIGHT=500
    AND TITLE='Composite Barchart Test'
    AND SIGNATURE='(C)2002, GOWI Systems'
    AND X_AXIS='Some Domain'
    AND Y_AXIS='Some Range'
    AND FORMAT='PNG'
    AND SHOWVALUES = 1
    AND SHOWGRID=1
    AND MAPNAME='compbars_map'
    AND ICONS=('t/pumpkin.png', 't/turkey.png' )
    AND MAPURL='http://www.gowi.com/cgi-bin/sample.pl?x=:X&y=:Y&z=:Z&plotno=:PLOTNUM'
    AND MAPTYPE='HTML'
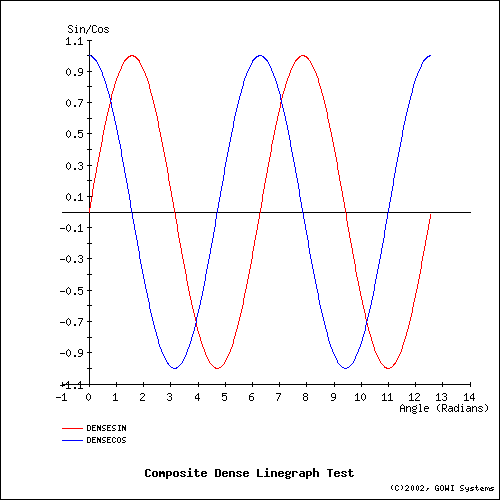
 Dense Linegraph See the SQL
select * from
    (select * from densesin
    returning linegraph(*)
        where color=red) densesin,
    (select * from densecos
    returning linegraph(*)
        where color=blue) densecos
    returning image
    where WIDTH=500
    AND HEIGHT=500
    AND TITLE='Composite Dense Linegraph Test'
    AND SIGNATURE='(C)2002, GOWI Systems'
    AND X_AXIS='Angle (Radians)'
    AND Y_AXIS='Sin/Cos'
    AND FORMAT='PNG'
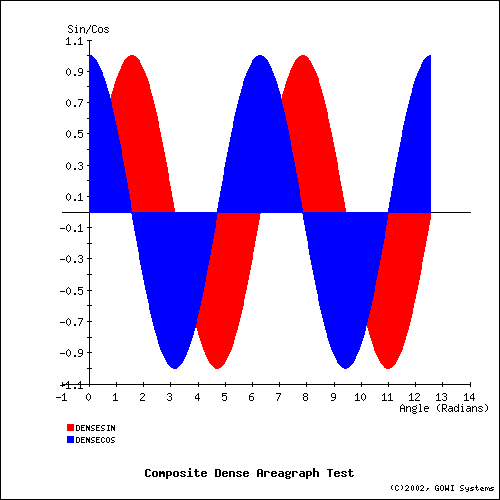
 Dense Areagraph See the SQL
select * from
    (select * from densesin
    returning areagraph(*)
        where color=red) densesin,
    (select * from densecos
    returning areagraph(*)
        where color=blue) densecos
    returning image
    where WIDTH=500
    AND HEIGHT=500
    AND TITLE='Composite Dense Areagraph Test'
    AND SIGNATURE='(C)2002, GOWI Systems'
    AND X_AXIS='Angle (Radians)'
    AND Y_AXIS='Sin/Cos'
    AND FORMAT='PNG'
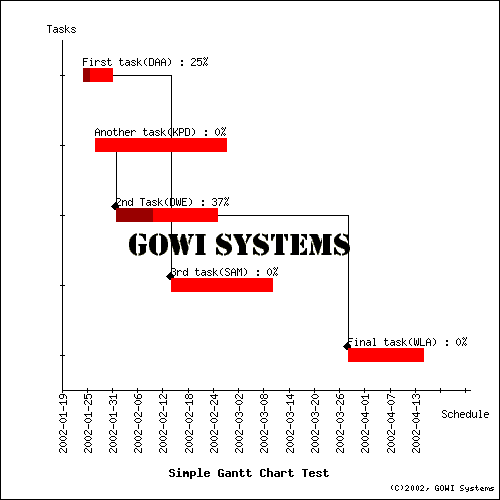
 Simple Gantt Chart See the SQL
select * from simpgantt
    returning gantt(*), imagemap
    where WIDTH=500
    AND HEIGHT=500
    AND TITLE='Simple Gantt Chart Test'
    AND SIGNATURE='(C)2002, GOWI Systems'
    AND X_AXIS='Tasks'
    AND Y_AXIS='Schedule'
    AND COLOR=red
    AND LOGO='t/gowilogo.png'
    AND MAPNAME='simpgantt_map'
    AND MAPURL='http://www.gowi.com/cgi-bin/sample.pl?x=:X&y=:Y&z=:Z&plotno=:PLOTNUM'
    AND MAPTYPE='HTML'
    AND X_ORIENT='VERTICAL'
    AND FORMAT='PNG'
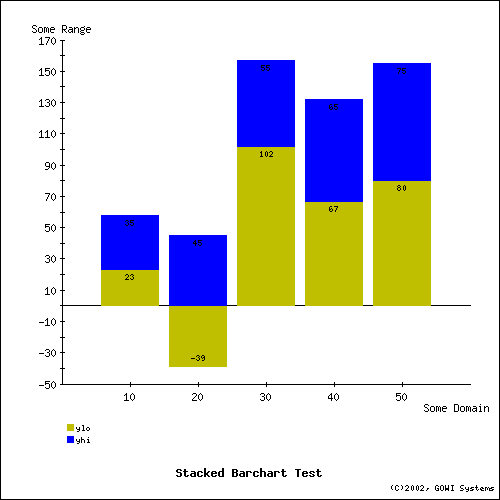
 Stacked Barchart See the SQL
select * from stackbar
    returning barchart(*), imagemap
    where WIDTH=500
    AND HEIGHT=500
    AND X_AXIS='Some Domain'
    AND Y_AXIS='Some Range'
    AND TITLE='Stacked Barchart Test'
    AND SIGNATURE='(C)2002, GOWI Systems'
    AND FORMAT='PNG'
    AND SHOWVALUES=1
    AND STACK=1
    AND MAPNAME='stackbar_map'
    AND MAPURL='http://www.gowi.com/cgi-bin/sample.pl?x=:X&y=:Y&z=:Z&plotno=:PLOTNUM'
    AND MAPTYPE='HTML'
    AND COLORS IN ('yellow', 'blue')
 Stacked Iconic Barchart See the SQL
select * from stackbar
returning barchart(*), imagemap
where WIDTH=500
AND HEIGHT=500
AND X_AXIS='Some Domain'
and Y_AXIS='Some Range'
AND TITLE='Stacked Iconic Barchart Test'
AND SIGNATURE='(C)2002, GOWI Systems'
AND FORMAT='PNG'
AND SHOWVALUES=1
AND STACK=1
AND ICONS IN ('t/pumpkin.png', 't/turkey.png')
AND MAPNAME='stackbar_map'
AND MAPURL='http://www.gowi.com/cgi-bin/sample.pl?x=:X&y=:Y&z=:Z&plotno=:PLOTNUM'
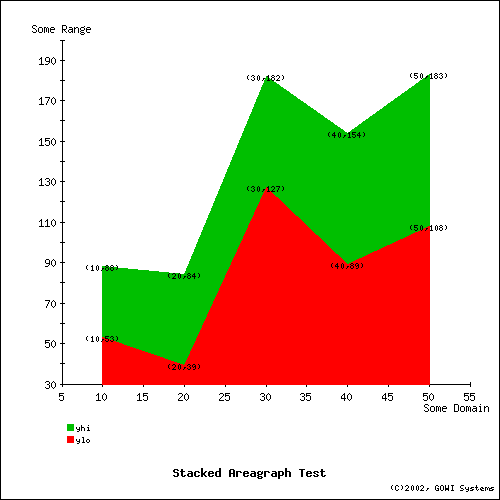
AND MAPTYPE='HTML'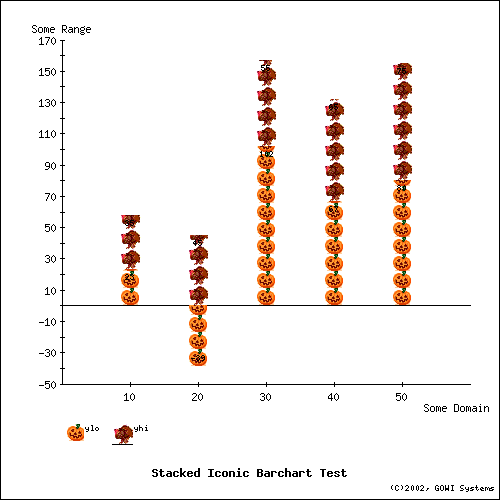 Stacked Areagraphs See the SQL
select * from stackbar
    returning areagraph(*), imagemap
    where WIDTH=500
    AND HEIGHT=500
    AND X_AXIS='Some Domain'
    AND Y_AXIS='Some Range'
    AND TITLE='Stacked Areagraph Test'
    AND SIGNATURE='(C)2002, GOWI Systems'
    AND FORMAT='PNG'
    AND SHOWVALUES=1
    AND STACK=1
    AND MAPNAME='stackarea_map'
    AND MAPURL='http://www.gowi.com/cgi-bin/sample.pl?x=:X&y=:Y&z=:Z&plotno=:PLOTNUM'
    AND MAPTYPE='HTML'
    AND COLORS IN ('red', 'green')
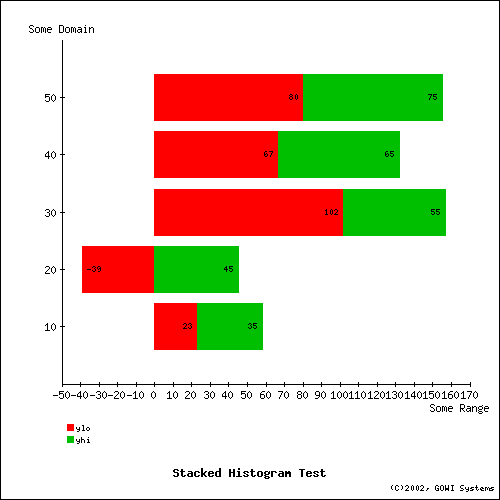
 Stacked Histogram See the SQL
select * from stackbar
    returning histogram(*), imagemap
    where WIDTH=500
    AND HEIGHT=500
    AND X_AXIS='Some Domain'
    AND Y_AXIS='Some Range'
    AND TITLE='Stacked Histogram Test'
    AND SIGNATURE='(C)2002, GOWI Systems'
    AND FORMAT='PNG'
    AND SHOWVALUES=1
    AND STACK=1
    AND MAPNAME='stackhisto_map'
    AND MAPURL='http://www.gowi.com/cgi-bin/sample.pl?x=:X&y=:Y&z=:Z&plotno=:PLOTNUM'
    AND MAPTYPE='HTML'
    AND COLORS IN ('red', 'green')
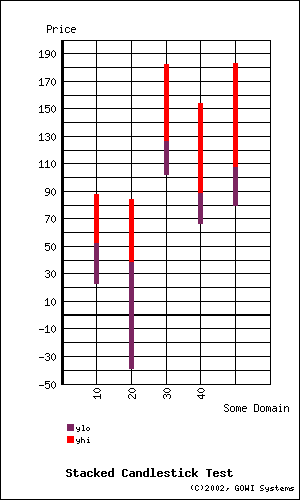
 Stacked Candlecharts See the SQL
select * from stackcandle
    returning candlestick(*), imagemap
    where WIDTH=300
    AND HEIGHT=500
    AND X_AXIS='Some Domain'
    AND Y_AXIS = 'Price'
    AND TITLE='Stacked Candlestick Test'
    AND SIGNATURE='(C)2002, GOWI Systems'
    AND FORMAT='PNG'
    AND COLORS IN ('newcolor', 'red')
    AND SHOWGRID=1
    AND STACK=1
    AND MAPNAME='stackcandle_map'
    AND LINEWIDTH=5
    AND MAPURL='http://www.gowi.com/cgi-bin/sample.pl?x=:X&y=:Y&z=:Z&plotno=:PLOTNUM'
    AND MAPTYPE='HTML'
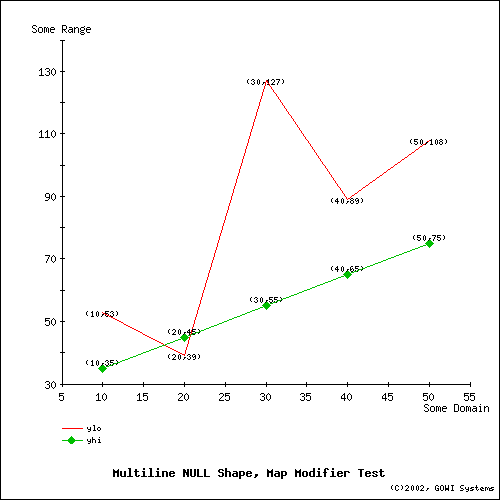
 Multiple Linegraph See the SQL
select * from stackbar
    returning linegraph(*), imagemap
    where WIDTH=500
    AND HEIGHT=500
    AND X_AXIS='Some Domain'
    AND Y_AXIS='Some Range'
    AND TITLE='Multiline NULL Shape, Map Modifier Test'
    AND SIGNATURE='(C)2002, GOWI Systems'
    AND FORMAT='PNG'
    AND SHOWVALUES=1
    AND MAPNAME='multilinemm_map'
    AND MAPURL='http://www.gowi.com/cgi-bin/sample.pl?x=:X&y=:Y&z=:Z&plotno=:PLOTNUM'
    AND MAPTYPE='HTML'
    AND COLORS IN ('red', 'green')
    AND SHAPES IN (NULL, 'filldiamond')
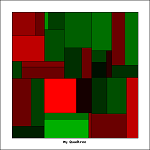
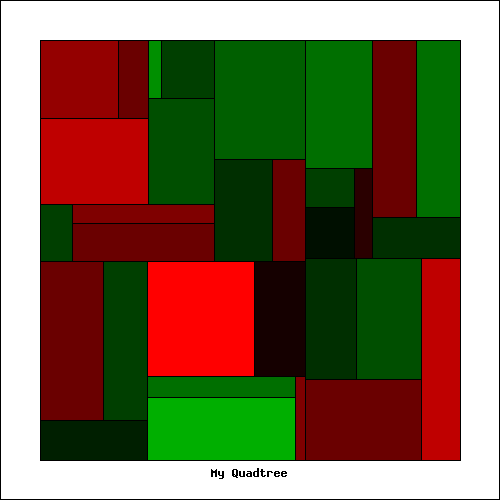
 Quadtree aka Treemap See the SQL
SELECT * FROM myquad
returning QUADTREE(*), IMAGEMAP
WHERE COLORS IN ('red', 'black', 'green')
    AND WIDTH=500
    AND HEIGHT=500
    AND TITLE='My Quadtree'
    AND MAPTYPE='HTML'
    AND MAPNAME='quadtree_map'
    AND MAPURL=
'http://www.presicient.com/cgi-bin/quadtree.pl?group=:X&item=:Y&value=:Z&intensity=:PLOTNUM'
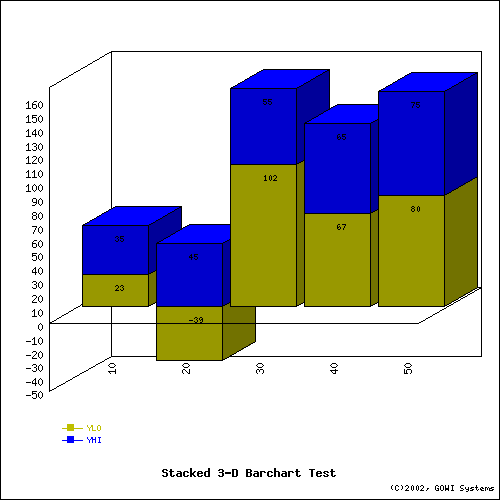
 Stacked 3D Barchart See the SQL
select * from stackbar
    returning barchart(*), imagemap
    where WIDTH=500
    AND HEIGHT=500
    AND X_AXIS='Some Domain'
    AND Y_AXIS='Some Range'
    AND TITLE='Stacked 3-D Barchart Test'
    AND SIGNATURE='(C)2002, GOWI Systems'
    AND FORMAT='PNG'
    AND SHOWVALUES=1
    AND STACK=1
    AND THREE_D=1
    AND MAPNAME='stack3Dbar_map'
    AND MAPURL='http://www.gowi.com/cgi-bin/sample.pl?x=:X&y=:Y&z=:Z&plotno=:PLOTNUM'
    AND MAPTYPE='HTML'
    AND COLORS IN ('yellow', 'blue')
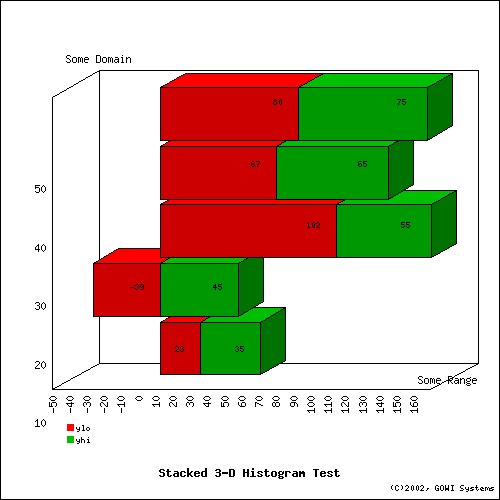
 Stacked 3D Histogram See the SQL
select * from stackbar
    returning histogram(*), imagemap
    where WIDTH=500
    AND HEIGHT=500
    AND X_AXIS='Some Domain'
    AND Y_AXIS='Some Range'
    AND TITLE='Stacked 3-D Histogram Test'
    AND SIGNATURE='(C)2002, GOWI Systems'
    AND FORMAT='PNG'
    AND SHOWVALUES=1
    AND STACK=1
    AND THREE_D=1
    AND MAPNAME='stack3Dhisto_map'
    AND MAPURL='http://www.gowi.com/cgi-bin/sample.pl?x=:X&y=:Y&z=:Z&plotno=:PLOTNUM'
    AND MAPTYPE='HTML'
    AND COLORS IN ('red', 'green')
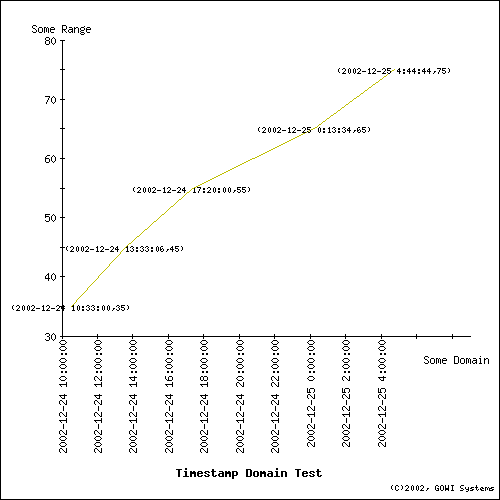
 Timestamp Domain Linegraph See the SQL
select * from tmstamp
    returning linegraph(*), imagemap
    where WIDTH=500
    AND HEIGHT=500
    AND X_AXIS='Some Domain'
    AND Y_AXIS='Some Range'
    AND TITLE='Timestamp Domain Test'
    AND SIGNATURE='(C)2002, GOWI Systems'
    AND FORMAT='PNG'
    AND SHOWVALUES=1
    AND MAPNAME='tmstamp_map'
    AND MAPURL='http://www.gowi.com/cgi-bin/sample.pl?x=:X&y=:Y&z=:Z&plotno=:PLOTNUM'
    AND MAPTYPE='HTML'
    AND COLORS IN ('yellow', 'blue')
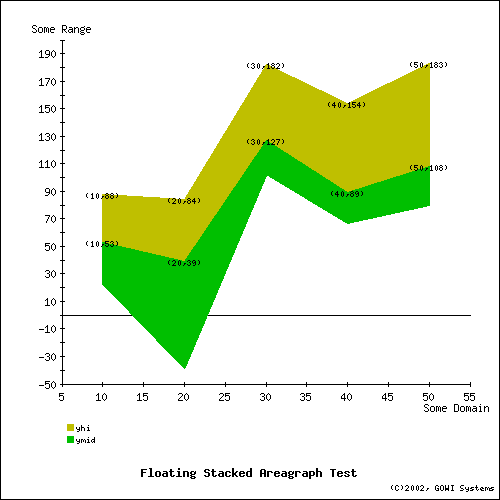
 Floating Stacked Areagraphs See the SQL
select * from floatbar
    returning areagraph(*), imagemap
    where WIDTH=500
    AND HEIGHT=500
    AND X_AXIS='Some Domain'
    AND Y_AXIS='Some Range'
    AND TITLE='Floating Stacked Areagraph Test'
    AND SIGNATURE='(C)2002, GOWI Systems'
    AND FORMAT='PNG'
    AND SHOWVALUES=1
    AND STACK=1
    AND ANCHORED=0
    AND MAPNAME='floatarea_map'
    AND MAPURL='http://www.gowi.com/cgi-bin/sample.pl?x=:X&y=:Y&z=:Z&plotno=:PLOTNUM'
    AND MAPTYPE='HTML'
    AND COLORS IN ('green', 'yellow', 'red')
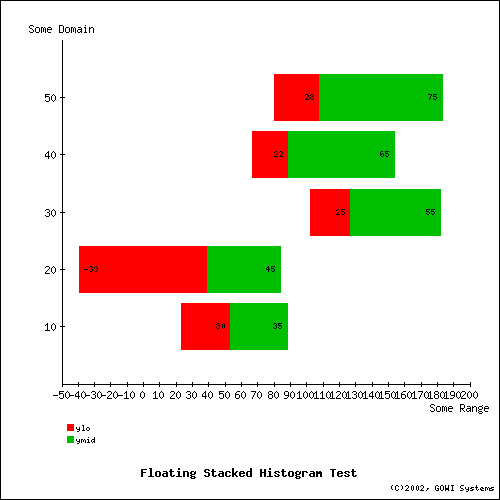
 Floating Stacked Histogram See the SQL
select * from floatbar
    returning histogram(*), imagemap
    where WIDTH=500
    AND HEIGHT=500
    AND X_AXIS='Some Domain'
    and Y_AXIS='Some Range'
    AND TITLE='Floating Stacked Histogram Test'
    AND SIGNATURE='(C)2002, GOWI Systems'
    AND FORMAT='PNG'
    AND SHOWVALUES=1
    AND STACK=1
    AND ANCHORED=0
    AND MAPNAME='floathisto_map'
    AND MAPURL='http://www.gowi.com/cgi-bin/sample.pl?x=:X&y=:Y&z=:Z&plotno=:PLOTNUM'
    AND MAPTYPE='HTML'
    AND COLORS IN ('red', 'green', 'orange')
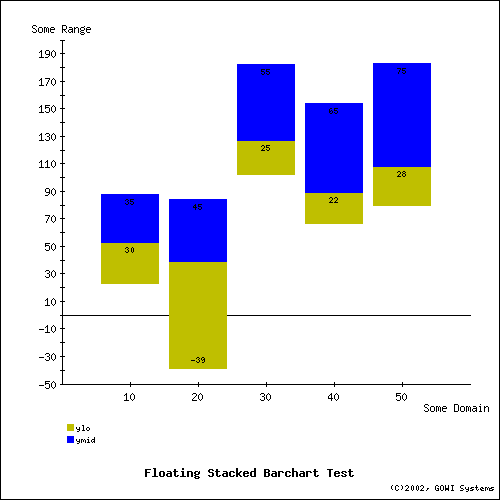
 Floating Stacked Barcharts See the SQL
select * from floatbar
    returning barchart(*), imagemap
    where WIDTH=500
    AND HEIGHT=500
    AND X_AXIS='Some Domain'
    AND Y_AXIS='Some Range'
    AND TITLE='Floating Stacked Barchart Test'
    AND SIGNATURE='(C)2002, GOWI Systems'
    AND FORMAT='PNG'
    AND SHOWVALUES=1
    AND STACK=1
    AND ANCHORED=0
    AND MAPNAME='floatbar_map'
    AND MAPURL='http://www.gowi.com/cgi-bin/sample.pl?x=:X&y=:Y&z=:Z&plotno=:PLOTNUM'
    AND MAPTYPE='HTML'
    AND COLORS IN ('yellow', 'blue', 'red')
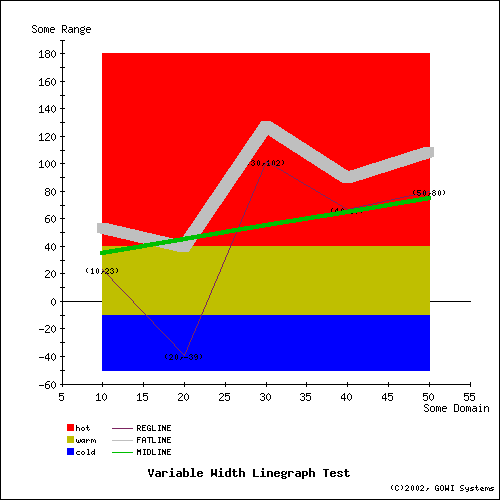
 Multiwidth Linegraph See the SQL
select * from
    (select * from floatbar
    returning areagraph(*)
    where anchored=0
        and stack=1
    AND colors in ('blue', 'yellow', 'red')),
    (select * from regline
    returning linegraph(*)
        where color='newcolor'
    AND showvalues=1 ) regline,
    (select * from fatline
    returning linegraph(*)
        where color='lgray'
    AND linewidth=10) fatline,
    (select * from midline
    returning linegraph(*)
        where color='green'
    AND linewidth=4) midline
    returning image, imagemap
    where WIDTH=500
    AND HEIGHT=500
    AND TITLE='Variable Width Linegraph Test'
    AND SIGNATURE='(C)2002, GOWI Systems'
    AND X_AXIS='Some Domain'
    AND Y_AXIS='Some Range'
    AND FORMAT='PNG'
    AND MAPNAME='multwidth_map'
    AND MAPURL='http://www.gowi.com/cgi-bin/sample.pl?x=:X&y=:Y&z=:Z&plotno=:PLOTNUM'
    AND MAPTYPE='HTML'
Driver Specific BehaviorData Source Name
The dsn string passed to Data TypesRefer to DBD::Chart's user guide for details regarding
SQL DialectCharts are rendered using the following SELECT statement syntax: Simple form:Composite form:
chart-prop-expr := <property> < = | IN > <literal-list>
literal-list := <? | literal [, literal-list ]>
When IMAGEMAP is included in the column list, text is generated for either
When any of the various
General Restrictions:
ColormapsThe colors used to render the various image elments can be adjusted by the application by modifying the predefined COLORMAP table. The COLORMAP table is predefined as follows:CREATE TABLE CHART.COLORMAP ( Name VARCHAR(30), -- name of color RedValue INTEGER, -- value of red component GreenValue INTEGER, -- value of green component BlueValue INTEGER, -- value of blue component );The color component values must be specified between 0 and 255. Refer to DBD::Chart for the predefined values in the COLORMAP table. For example, to define a new color:
$dbh->do('INSERT INTO COLORMAP VALUES('chartreuse', 230, 179, 180);
To modify an existing color:
$dbh->do("UPDATE COLORMAP SET REDVALUE=100 WHERE NAME='marine'");
To fetch the current values of an existing color:
$sth = $dbh->prepare("SELECT * FROM COLORMAP NAME='marine'");
$sth->execute;
$row = $sth->fetchrow_arrayref;
Finally, a generic parameterized statement can be used to define colors at runtime:
$sth = $dbh->prepare("INSERT INTO COLORMAP VALUES(?, ?, ?, ?)");
$sth->execute('marine', 127, 127, 255);
Note that using non-alphanumeric characters in color names may cause parsing
problems, so stick to alphanumerics, e.g., 'red3'.
Error HandlingAny errors generated from improper SQL usage are flagged with an error value of -1, and appropriate text in the errstr. Errors emanating from DBI, or any underlying DBI driver, will be flagged in err and errstr with whatever info is returned. Diagnostics
DBI provides the Driver Specific AttributesWhile the application does not have direct access to the DBD::Chart handles used by DBIx::Chart, the following attributes will be passed to DBD::Chart when provided:
Any other attributes will be passed to the driver defined by the connect() DSN string. Restrictions and Limitations
Change History
TO DO List
AcknowledgementsMany thanks to all the authors of the various GD, PNG, JPEG, and zlib modules. Special thanks to Tim Bunce for providing sublassing, and suggesting SQL syntax. References
AuthorCopyrightCopyright© 2002-2008, Dean Arnold, Presicient Corp., USA Permission is granted to use this software according to the terms of the Perl Artistic License. |
