| <<Prev | TOC | Next>> |
 |
TeraForge Tutorial 1: Data Load Project |
 |
| <<Prev | TOC | Next>> |
 |
TeraForge Tutorial 1: Data Load Project |
 |
The load script can be run via standalone BTEQ, or within TeraForge. Running within TeraForge makes for a simple, gentle introduction to TeraForge's capabilities, so we discuss that process.
The TeraForge IDE consists of 6 major widgets:



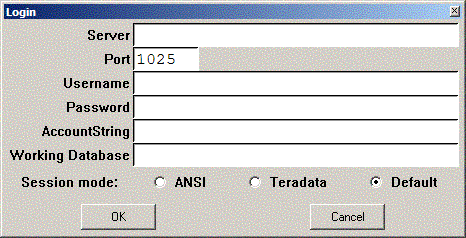
Enter your logon information:
Then click OK. Assuming the logon completes successfully, you will be presented with a New Project dialog like the following:
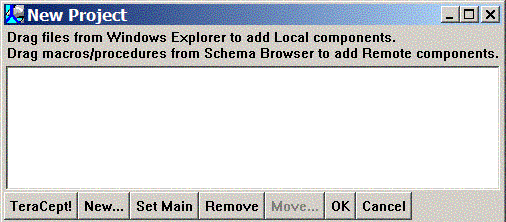
Since this is a simple project, we only need to add a single file. We'll be adding a BTEQ script as an executable heredoc shell script. This file already exists in the tutorial directory as "loadcapper.btq". To add it to your project, drag and drop from a Windows Explorer window into the New Project dialog:

(In a subsequent tutorial, you'll learn how to drag and drop existing macros and procedures from the database into your project.)
The New Project dialog should look similar to this:
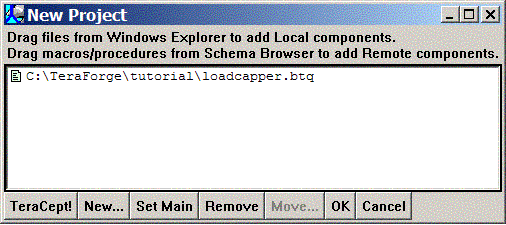
Select the loadcapper.btq filename entry by left-clicking on it, then click the Set Main button to make it the main component of your project.
We're now done with creating our project, so click OK. A File Save dialog is presented to save the newly created project as a TeraForge Project File. In the File name: entry, enter "loadcapper.tfg" (Note that TeraForge Project files use the ".tfg" suffix by default). Click OK to proceed.
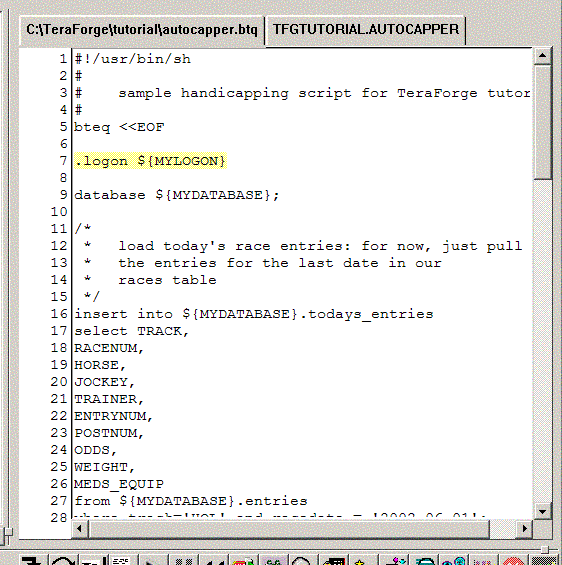
At this point, TeraForge will load the BTEQ script into the Source Window. In addition, it will print some information in the Results Window:
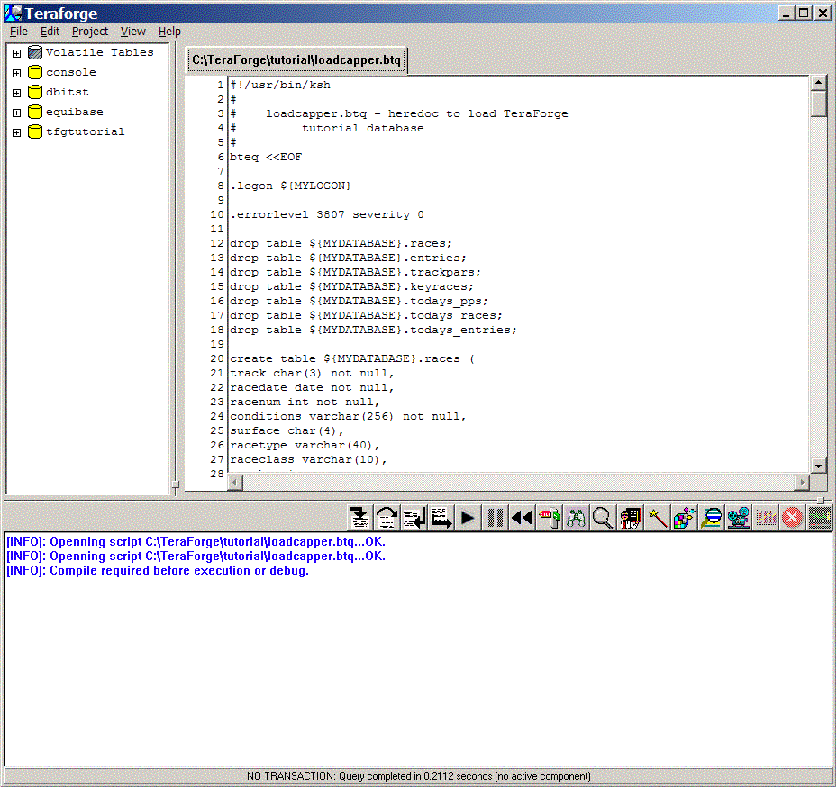
Now we need to compile our script. Click the Project->Compile menu item. Note the compilation information in the lower Results Window. The Results Window acts as a console window to which error, warning, and informational messages are output while compiling, debugging, or running a project. It also acts as the output window for any result data that would be displayed by a BTEQ script.
Note that we used some shell variables in our script. During compilation, TeraForge will capture these shell variable references, and then ask you to provide definitions.
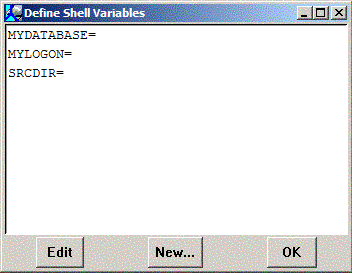
Double click on the "MYDATABASE=" entry. Yet another dialog is presented:

Enter the name of the database you want to use to store the autocapper tutorial data you'll be creating, and then click OK. The Define Shell Variables dialog is now updated with the value you assigned. Do the same for the "MYLOGON=" and "SRCDATA=" entries, adding the logonstring and the directory path where the races.txt and entries.txt tutorial data files are located. Below is an example of how the updated dialog should look after you've assigned both values:
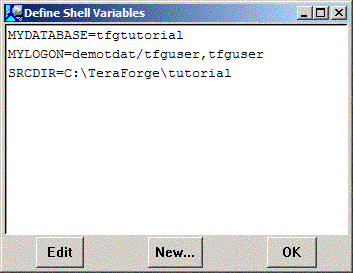
Since we're done defining shell variables, click OK to continue.
At this point the compilation continues, substituting the newly defined shell variable values where needed. The compilation now completes without errors, but we do have warnings:

During compilation of scripts, TeraForge attempts to PREPARE each SQL statement in the script to validate it. In cases where a statement references a database object which does not yet exist, TeraForge flags the statement with a warning. TeraForge does not consider the missing object to be an error, as some preceding statement may have actually created the referenced object.
Also note the yellow highlighted line on the ".logon" statement. The yellow line indicates the current execution line; since we haven't started running the script yet, the current line is positioned on the first non-comment line in the script, namely, the logon statement.
Since the script has compiled free of errors, we can now
run the script. While we could just click the Continue
 button
from the button bar and let the script run to completion,
this is a good opportunity to try out some of the debugging features
of TeraForge.
First, let's set a breakpoint at line 180:
Your display should look now look like this:
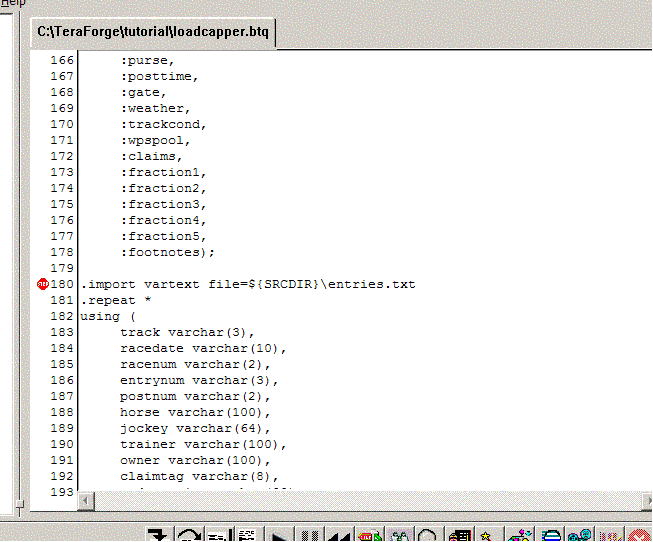
The statement is now highlighted in light red, indicating it has a breakpoint.
Now click Continue from the button bar.
The script will proceed to execute each statement up to our breakpoint.
However, since animation
  hasn't been
enabled, there's no visual "feedback" indicating that the script
is being executed, other than the information being printed in the Results
Window, and the "graying" of the Source Window:
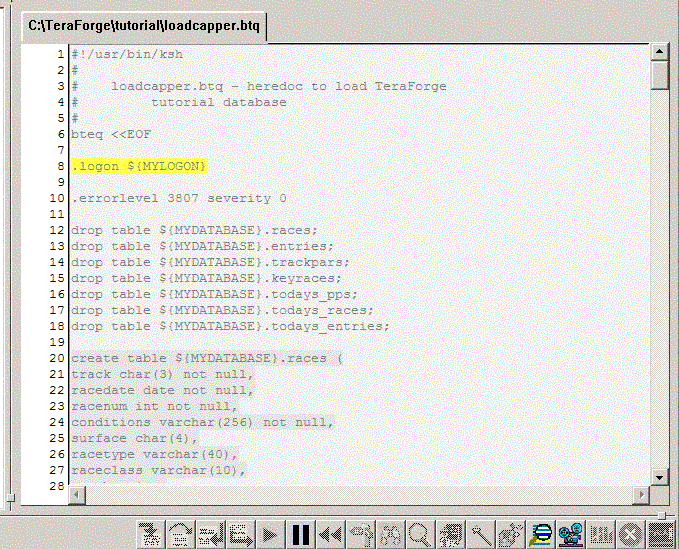
Click the Enable Animation  button;
you should now see the current statement indicator move through the
Source Window as statements are executed, and the animation button
changes to Disable Animation
  .
(Note that the movement of the current statement indicator may not
be obvious if a long running SQL statement is executing, or a single SQL
is being executed repeatedly with import data).
Since we're loading our races table via a REPEAT operation, the execution may take 30 seconds or more to reach our breakpoint. Also note the status bar at the very bottom of the output window: as each statement executes, the status bar tells you when a statement is executing, and, upon completion, an updated execution time, and any current transaction state.
Eventually, TeraForge hits our breakpoint and stops execution. At this point, we can take a look at what happened in our database. Click and drag across the text "${MYDATABASE}.races" at line 131 to select it:
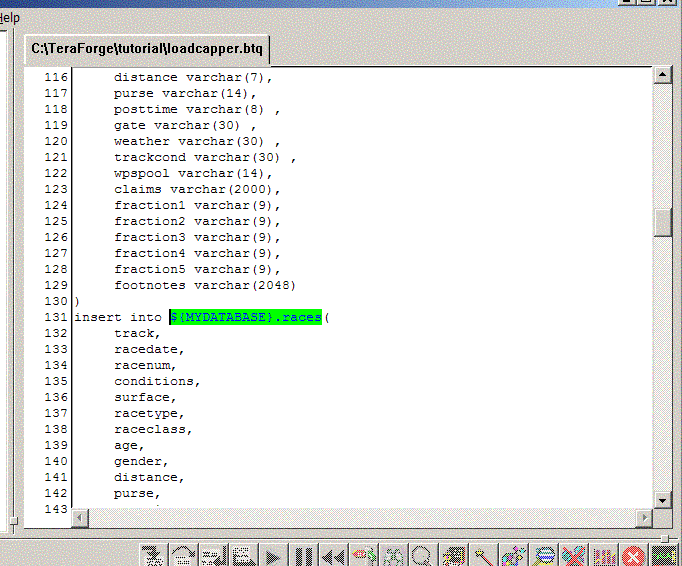
The selected text should now be highlighted. Now click the
Inspect button from the buttonbar.
A dialog is presented with a template query to be executed to
retrieve the contents of the races table.
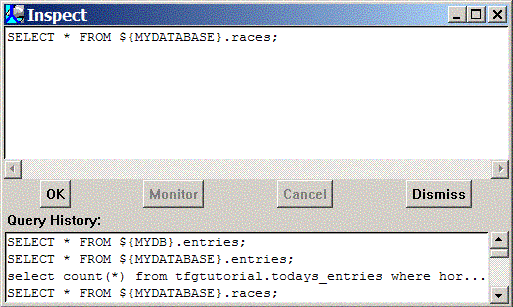
Notice the Query History list
at the bottom of the Inspect dialog. Whenever a query is executed
via the Inspect  , Preview
  ,
Explain
  , or Execute
  buttons, and the query was not already in the Query History list,
the resulting query is added to the Query History list (up to the
last 20 queries). You can then execute the same query later by simply double-clicking
on the query in the Query History.
Click OK. A spreadsheet will appear with the data we just loaded into the table:
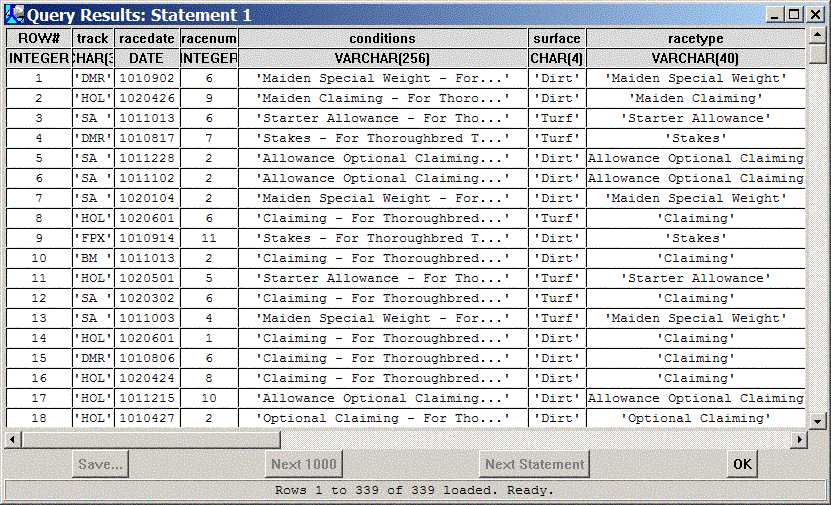
Note the Next 1000 and Next Statement buttons, which are disabled. For queries returning large result sets, the spreadsheet only displays 1000 rows at a time, and clicking Next 1000 permits advancing to the next set of rows. Likewise for multistatement queries, clicking Next Statement permits advancing to the next statement in the request.
NOTE: Eventually the Save... button will permit saving query results in CSV, Excel, VARTEXT, or Teradata binary format.
Click OK to close the spreadsheet.
Since we're done with the Inspect dialog, click Dismiss to close it.
Now let's take a look at the current execution stack. The execution stack
shows the hierarchy of various scripts, procedures, and macros
(aka components) that are
currently active in our execution hierarchy, or "call tree", as well
as any local variables or input parameters of the components.
Finally, the current activity count and errorcode values are maintained
at the bottom of the stack as "global" values. Since we're using
a standalone script, there's not much interesting to see, but
click on the View Stack button anyway, and then
click on the open/close indicator for the "Base" stack frame:
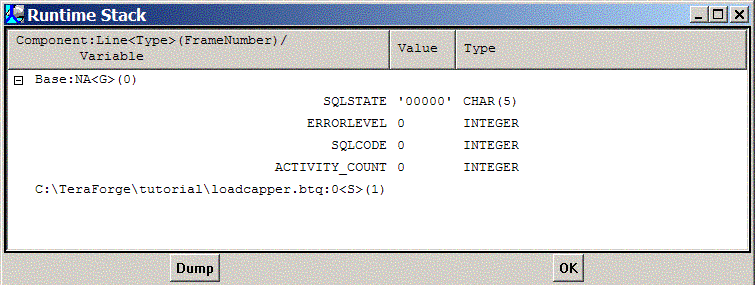
By opening the Base frame, you can inspect the global variables SQLCODE, SQLSTATE, ACTIVITY_COUNT, and ERRORLEVEL. You'll get a chance to do more stack manipulation later in the next tutorial.
Click OK to close the stack dialog.
Now try single stepping. Click
Step Over on the button
bar. Note that the highlighted current line has moved to the next
statement in our script. You could also click
Step Into
 to get the
same effect. The difference ? Step Into would've
taken you into the source of any component
that a statement might have called (via .RUN, EXECUTE, or CALL),
whereas Step Over will silently execute the called component without
showing the source...unless a breakpoint is encountered within
the called component.
Now try Step To .
Scroll down the source to the ".quit"
statement, click on it to move the insert cursor there, and then click
the Step To
 button. Execution of
the script continues, highlighting each
statement along the way as it is executed, until it hits the line you
indicated to Step To. Note: Since you're loading the tables
with a few thousand rows, execution may take awhile to reach your
Step To statement.
Click Continue. The script has now completed, and the tutorial database is loaded.
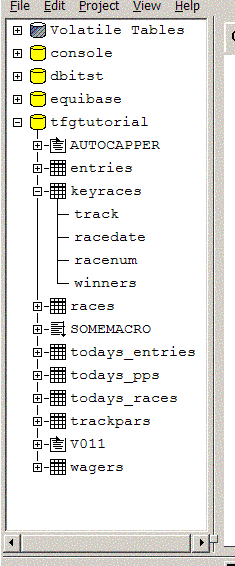
Now that you've got some data into your database, you can explore the
the data you've loaded with the Schema Browser on the left side of the
TeraForge display.
Click the database node indicator for the
database in which you've loaded the data. The node should open and
present any database objects defined within the database, including
 Tables
 Views
Views
 Macros
 Stored Procedures
 Indexes
 Triggers
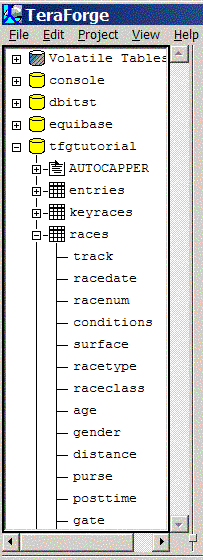
Click on the races table indicator to open it. The columns defined in the races table are displayed
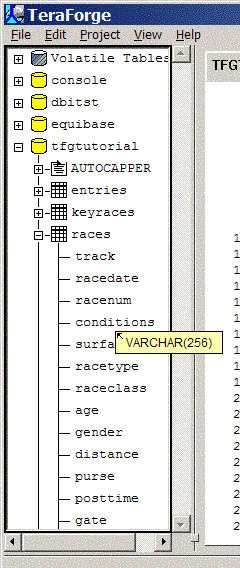
Now hover your mouse over the various columns; you should see a small balloon displayed with the type information for the associated column:
Now doubleclick on the races table icon; a new readonly dialog appears with the DDL for the table:
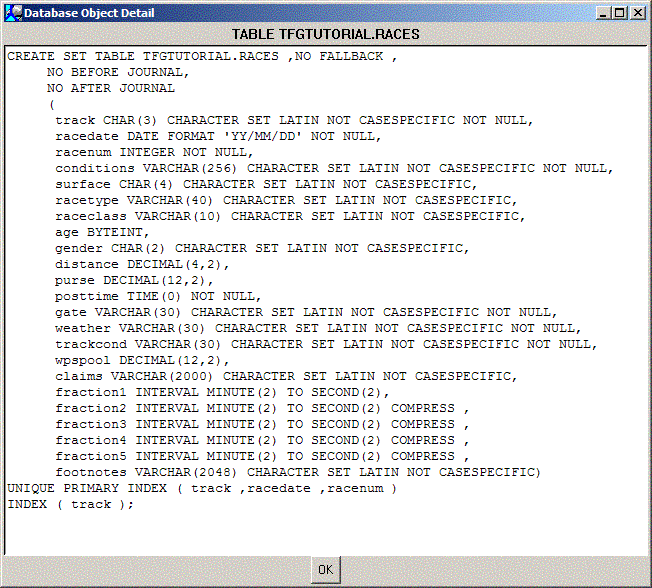
You've now completed the introductory tutorial to using TeraForge to create, compile, debug, and execute a project. The next tutorial expands on this by showing how to create a project with new components, and adding a stored procedure.
| <<Prev | TOC | Next>> |